What Are the Benefits of Visual Note-Taking?
Written language transformed the world when it was invented 5,500 years ago in Mesopotamia – now known as Iraq. This innovation allowed humans to store information outside of their brains and pass it on from person to person more easily. And today, writing and note-taking are trivial but essential tasks to our day-to-day lives. In this article, we are going to explore the benefits of visual note-taking.
What is visual note-taking?
Visual note-taking is the process of using text, images, and other graphics to store information. Traditional note-taking, which has not changed much since the Mesopotamians first used it all those years ago, involves using only text.
Traditional note-taking has stood the test of time, clearly. The article you are reading currently, indeed, is following that format.
But written notes have their limitations, while visual notes have some key benefits.
What are the benefits of visual note-taking?
Often, explaining the relationships between ideas in text is time consuming – both for the writer and the reader. Let’s look at an example:
We have three concepts: cats, cat food, and humans. Cats live with humans. Humans, meanwhile, buy cat food. Cat food, in turn, is eaten by cats.
That clunky paragraph can be represented visually in a concept graph:
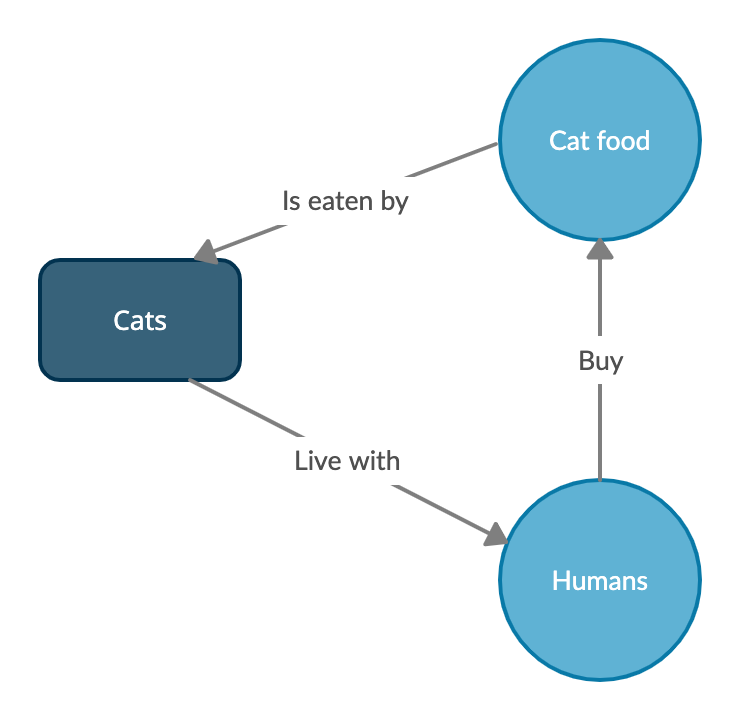
Represented visually, the cat, cat food, and human relationships become clearer. It is easier to see, and understand, the big picture.
Ask yourself the question: which is easy to remember, the paragraph, or the diagram?
If you answered the diagram, then you are aligned with the science. Research has shown that we remember images better than text.
Here are some benefits of visual note-taking, according to Education Week:
- 90% of information we take in daily is visual
- Visual elements can increase memory retention by up to 65%
- Visual note-taking can increase comprehension and data retention by 22-30%
- It helps learners understand big ideas
How to use visual note-taking effectively
There are three components to visual note-taking:
- Text: Although we aim to represent information visually, text is required for our notes to make sense and to outline the key ideas.
- Images: Unsurprisingly, visual content – i.e. images – is essential to visual notetaking. A picture says a thousand words!
- Structure: How do all your ideas fit together? The flow of information should be organized to give the big picture meaning.
The best visual note-taking tools
Let’s review four diverse note-taking tools:
- Pen and paper
- Presentation software
- Mind mapping tools
- Concept maps with Gloow
Pen and paper
There is a huge range of tools you can use to represent ideas visually. One tool is as old as the hills: a pen and paper. The main benefit of visual note-taking with a pen and paper is how flexible you can be in your designs!
However, written notes have some serious limitations. They can quickly become messy – especially for those of us with scruffy handwriting! You’re also constrained by the size of the paper you use.

Paper essentially just doesn’t store much data. A piece of A4 with small handwriting and single spacing would probably hold 10kb of text. Adding in some hand drawn imagery for a visual plan, we might get up to 100kb – in today’s computing terms, that’s nothing.
Pens and paper have produced some of the finest works in human history. But for modern day visual note-taking, it has some constraints.
Presentation software
For years, the corporate world has used presentation software (such as Powerpoint or Google Slides) to communicate information visually. They are very effective for presentations – as you would expect from the name “presentation software”.
However, they are static. You can only interact with the content when editing. As such, for dynamic plans, they’re not ideal.
Mind mapping tools
There is a vast selection of mind mapping tools on the internet. Where to begin?
Most of these tools follow the structure of traditional, hand-drawn mind maps: a central theme in the middle from which all ideas and thoughts spring. In other words, they have an information hierarchy, with ideas diminishing in importance – at least visually – as you move outwards from the centre. They are good for plans based around one central theme.
Concept maps with Gloow
Gloow is a concept mapping tool that enables you to connect ideas, concepts, and thoughts. Information is arranged in “nodes”, and any one node can connect to another.
The gif to the right shows an example of how information is structure in a Gloow concept map.
We’re looking at a marketing plan for an Online Store, the black-colored node. Marketing channels are connected to that, each in lavender purple. Meanwhile, content types are in teal, and strategies are in pink.
All the information is neatly linked together, and easy to search, visualise, and browse.
There are many ways to make visual notes, each with their own strengths. The place to start is to explore some of these tools, and decide which you like best!